China’s fixed asset investment: What the heck is going on?

Fixed asset investment (FAI) – covering everything from roads to rail, ports to bridges, houses to factories – has long been a key pillar of China’s economic growth.
But in June, something unexpected happened: China’s fixed asset investment (FAI) fell into the red, declining 0.1% y/y. Since then, FAI’s decline has accelerated, falling a whopping 12.2% by October.
This is unprecedented: Outside the pandemic years, FAI has never declined for this long. Shrinking FAI will eventually weigh on activity – but it is not a sign of an economy in meltdown. Below, we lay out the four main forces driving the drop in FAI.
1. The anti-involution push
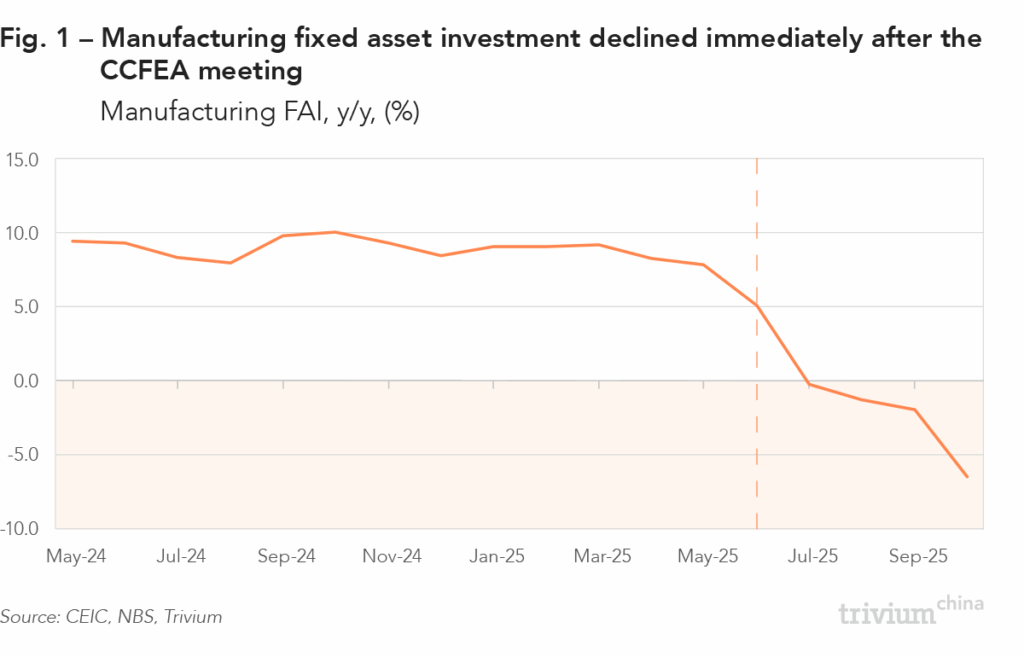
After an impressive 59 months of consecutive growth, manufacturing investment slipped into the red in July and has continued to decline – at an accelerating pace – ever since.Much of this pullback reflects Beijing’s campaign against overcapacity [Fig. 1]. In early July, the Central Commission for Financial and Economic Affairs (CCFEA) – the Party’s top economic policymaking body – pledged to crack down on the “involution-style” competition plaguing China’s economy, from petrochemicals to electric vehicles (NEVs), and cleantech to metals. The CCFEA said it would rein in price wars, improve product quality, and support the “orderly exit” of outdated capacity. Later that month, the Politburo reaffirmed these policies at its monthly meeting.
Since then, there has been a flurry of industry meetings, guidelines, and ministerial symposiums aimed at encouraging sectors to reduce excess capacity.
Autos
- In mid-July, the industry regulator (MIIT) convened an industry symposium to discuss guidelines to curb competition in the new energy vehicle (NEV) sector.
- Later that month, the China Auto Association released its “Initiative for Maintaining Fair Competition.”
Photovoltaics and batteries
- In early July, MIIT held a symposium to promote the orderly exit of outdated capacity.
- The following month, government agencies issued a 12-month action plan aimed, among other things, at avoiding inefficient expansion of PV and lithium-ion batteries.
Other sectors
- In August, the plastic processing industry association agreed to reduce existing capacity and shelve any expansion plans. A few days later, China’s plastic pipe industry released an initiative to “optimize” capacity.
- In the same month, MIIT and other ministries released a growth plan for non-ferrous metals, calling for the avoidance of redundant capacity. Then, in October, the Non-Ferrous Metals Industry Association held a meeting focused on avoiding involution-style competition.
- In September, MIIT and other ministries released a growth plan for the chemicals industry that aims to prevent overcapacity risks and manage the pace of capacity expansion.
These initiatives are bearing fruit. Since July, FAI in:
- Electrical equipment manufacturing – including solar panels and batteries – dropped 12.7% y/y
- Chemicals manufacturing fell 14.3%
- Plastics production declined 6.3%
- The production of non-ferrous metal products edged down 3.8%
The only area bucking this trend is the auto sector, where FAI into auto manufacturing facilities grew 13.5% in Q3, albeit sharply down from 22.2% in H1.
2. Local government bonds and redirected investment
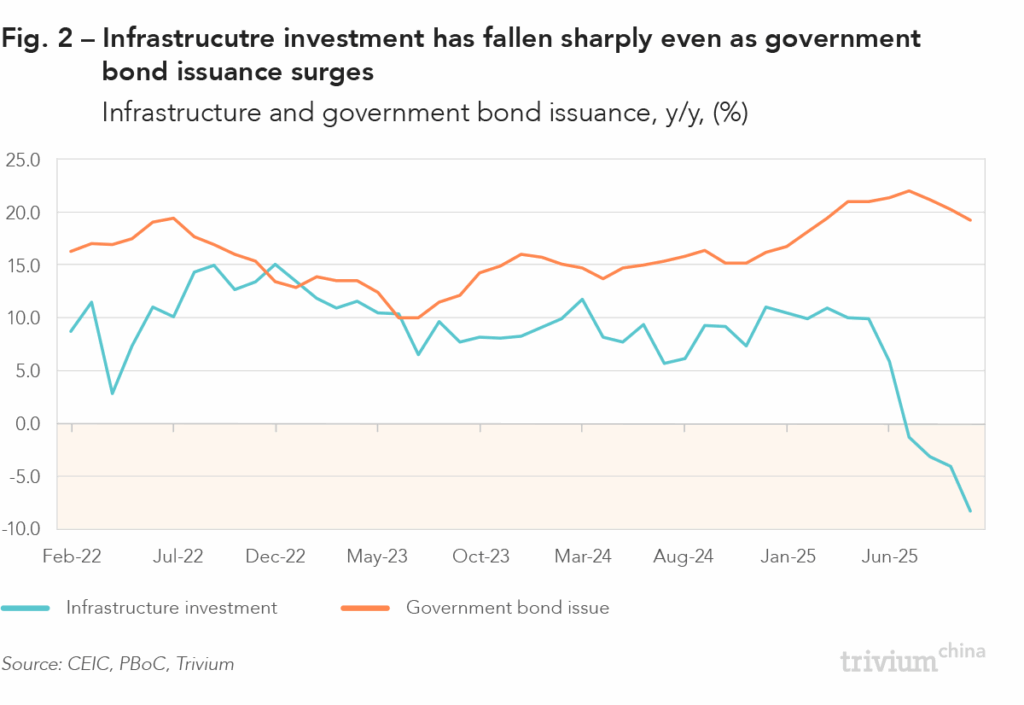
Since July, infrastructure spending has declined by approximately RMB 387 billion relative to 2024 levels, representing a 4.4% drop. At the same time, issuance of government bonds – the main debt instrument used to fund public infrastructure – has soared [Fig. 2]. Where has the money gone?
This year, the Ministry of Finance (MoF) expanded the use of local government special-purpose bonds (SPBs) – a debt instrument typically used to fund infrastructure investment – to allow localities to pay down hidden debt obligations. The MoF provided local governments with an RMB 800 billion quota for this purpose – on top of the SPB quota – so, in principle, this shouldn’t have interfered with infrastructure spending.
However, bond issuance data shows that local governments have spent around RMB 1.32 trillion this year paying down hidden debt. This additional RMB 500 billion beyond the MoF quota likely came from funds originally earmarked for infrastructure.
It’s not just local authorities who are spending less on infrastructure. In the final quarter of 2023, Beijing issued RMB 1 trillion of special treasury bonds (STBs) – an off-balance sheet debt instrument – of which half was earmarked for infrastructure spending in 2024. Meanwhile, between Q1-Q3 2024, Beijing issued an additional RMB 1 trillion – together, that equates to roughly RMB 1.5 trillion of STB funding. For comparison, in the first three quarters of this year, Beijing has issued RMB 1.3 trillion in STBs.
Infrastructure spending this year has also been interrupted due to adverse weather conditions. Heat waves and drought have disrupted construction of existing projects and caused longer lags between fund disbursement and new projects kicking off. Because fixed-asset investment in China is recorded when work is carried out – not when funds are issued or projects approved – these weather-related interruptions translate directly into weaker monthly investment figures.
This combination of redirected funds, less STB issuance, and weather-related delays has contributed to the overall slowdown in infrastructure spending.
3. Real estate and upstream spillovers
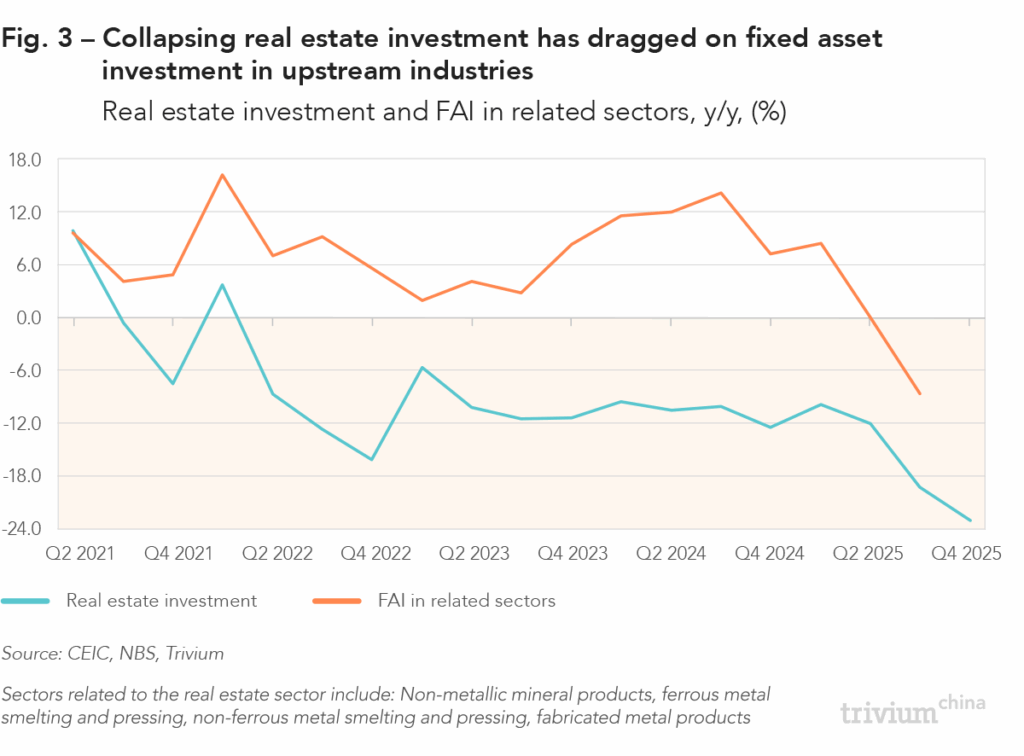
Real estate investment – accounting for roughly one fifth of China’s aggregate FAI – contracted 23.0% y/y in October, the fastest decline since the property slump began in 2021. Remarkably, the rate of decline has accelerated every month this year, making real estate a major contributor to the aggregate FAI slowdown.
The property sector is also closely intertwined with upstream industries supplying raw and processed construction materials. As developers scale back construction, demand for materials like steel, glass, bricks, and cement drops, leading manufacturers in these sectors to pull back on FAI [Fig. 3].
These second-order spillover effects further exacerbate the decline in aggregate FAI, far beyond real estate.
4. Deflation, mergers and acquisitions, and broader investment trends
Analysts and financial media have cast doubt over the reliability of China’s FAI statistics, noting that GDP headline figures seem unaffected. But this is a fundamental misunderstanding of how GDP is measured. When calculating quarterly GDP, the stats bureau (NBS) doesn’t use FAI, but instead uses a metric called Gross Capital Formation (GCF). Understanding the difference between these two measurements helps us explain what is driving the sharp decline in FAI.
- Scope – FAI captures total expenditure on all long-term assets, while GCF focuses on new, productive assets, excluding land purchases, mergers and acquisitions (M&A), and second-hand capital equipment.
- Measurement – FAI is nominal (incorporating price effects), while GCF is usually reported in real terms.
In Q3 2025, GCF contributed 0.9 percentage points to GDP growth, versus a 6.6% drop in FAI.
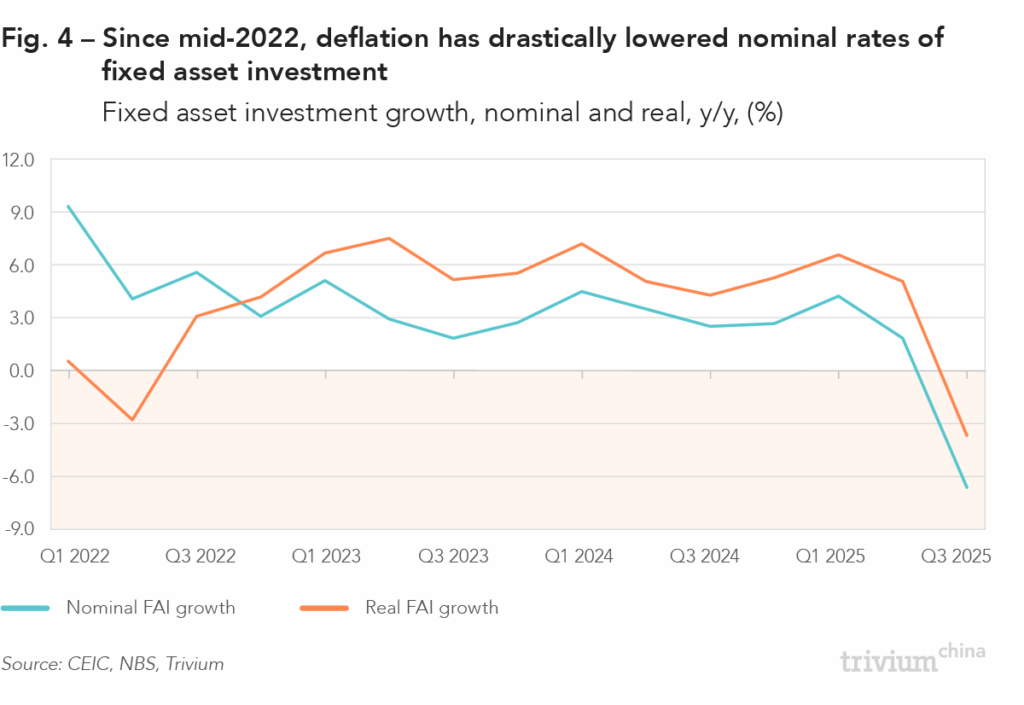
First, part of this gap reflects deflation: Producer prices fell 2.9% in Q3, so while the nominal value of FAI fell 6.6%, in real terms it only declined 3.7% [Fig. 4].
Second, the gap points to a sharp contraction in FAI items that are not included in the GCF measurement, such as land purchases, M&A, and second-hand equipment.
Summary
The slowdown in FAI is multifaceted:
- Anti-involution policies are curbing manufacturing.
- Local government bonds are increasingly redirected to hidden debt repayment and other non-infrastructure uses, while adverse weather has delayed infrastructure works.
- Over the past 12 months, central authorities have issued fewer STBs to fund infrastructure investment.
- The real estate contraction has hammered FAI through both first- and second-order effects.
- Deflation has put further downward pressure on the nominal value of FAI.
- Reduced activity in M&A, land markets, and other investments that don’t directly contribute to GDP has further widened the gap between FAI and productive capital formation.
Outside the investment and real estate slump, however, China’s broader macro data looks more resilient. Industrial output continues to expand at a pace broadly in line with pre-pandemic trends and, while consumption is soft at the headline level, spending on services remains firm. The outlook for exports is also positive, especially given signs of recovery in shipments to the US. These areas of resilience help offset the drag from weakening investment and reinforce the picture of an economy that may be cooling but is far from stalling.